Nasa ParaWing
send me a mail 

profile computation
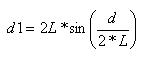
Here is the "heart" of excel spreadsheet,
just a few maths formulas, don't be afraid !


  • Here is the wing profile that you should get using bridles lengths provided in excel spreadsheet
    • profile is computed and plotted automatically as a function of other parameters
    • on the left side is main body profile (A side)
    • on the right side is wing profile (B side)
    • profile is accessible on "cascade_profile" page of excel spreadsheet

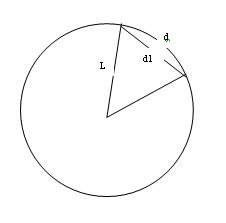
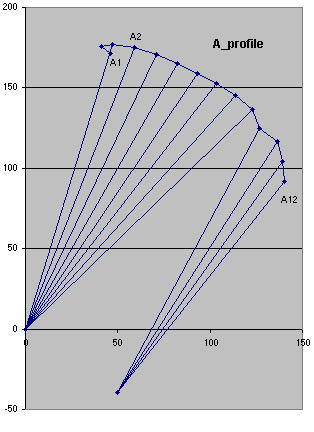
details on profile computation


  • brakes influence
    • brakes and main lines are shifted with Q and Q' length
    • this length directly depends on handle length and wing length 

     
  • We know :
    •  
    • L1 = average length of a bridle
    • d1 = average distance (on the sail)  between the middle of A pulling lines and A braking lines
    • L2 = length of flying lines
    • d3 = length of handle

    •  

     
  • We have (Thales formula)  :

     
  • so we get d2 = Q_Q’ 
  • d1 distance is computed (approximation) as the cord of the circle (asuming that kite shape is a circle whose diameter is twice the bridle length (L) ).

  • If we want to draw the plot of the kite profile, we first position tha first bridle and then « construct » the shape line per line
  • We know :
    •  
    • L1 = line length of « previous » line
    • x1 and y1 cartesian coordinates of  end of line 1
    • L2 = line length of the line to be positioned
    • d = distance on sail between line 1 and the current line

    •  
  • we search (x, y) the cartesian coordinates of end of line L2
  • We see that the point (x, y) describes a circle whose diameter is 2d.
  • The equation of this circle is given by formula (1)

  •  

      if we notice that 
      we get 
  • To know where to position (x, y) point on the circle we have the length of the line L2
    In the most complicate case, L2 line is attached to brake line (Q’ point). This point has a coordinate (X1, Y1) which is fixed by Q_Q’ distance (D) and the angle of handle.

    Note that if we choose D = 0 then Q’ point is equal to Q point. This means that L2 line is NOT a brake line. So the same formula can be used both for brakes and not brake lines !


  • Point (x, y) describes this time a new circle centered at the top of L2 line and with a diameter of 2L2.

  •  


    Equation of this circle is given by formula (2)

    f we notice that 
    we get 
     
  • substracting (2) to (1) you get the point of intersection of the two circles 


    if you replace y given by (3) in formula (2) you get a nice second degree x equation (4)

    (4) can be writen in the usual form 

      where the only « unknown » is x

    the solution (we only keep the greatest x value) is 


advanced use of excel spreadsheet


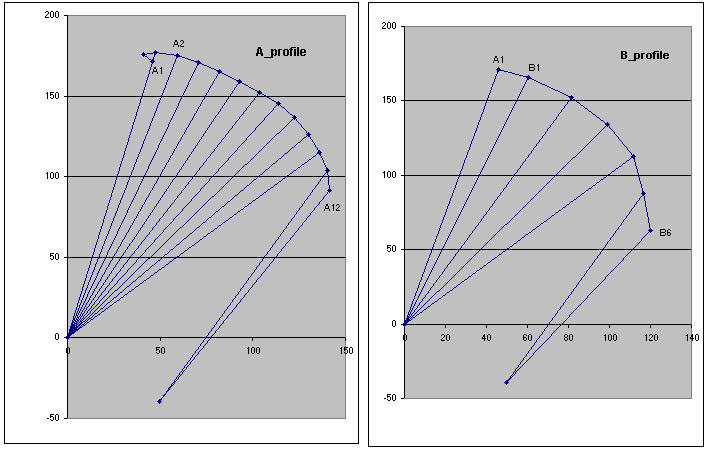
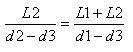
You can modify some parameters of the excel spreadsheet to draw your own profiles

here are accessibles parameters :

  • flying lines length and handle size
  • "bridals" page cells A 43 to 47
  • brakes configuration
    • cells A 52 to 74
    • a "0" in this cell means a flying line
    • a "1" in this cell means a brake line
    • notice that the excel spreadsheet is provided with a standard configuration 
      • brakes on A11, A12
      • brakes on B5, B6
  • when you modify brakes configuration, this will affect shape of the profile

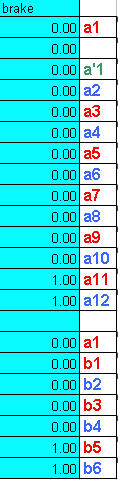
  • here I have intentionnaly put a brake on A9 to A12 lines without modifying bridles lengths
     
  • this is NORMAL
  • to smooth the profile you must modify bridles lengths.
    • in excel sheet display hidden column B into "calculations" page
    • play with reference lengths for needed lines (cells B14 to B35)
  • example :
    • no brakes  : you will get a two lines profile !!!